In my 20-plus years involved with the automotive industry, I've come to know hundreds of talented technicians. I've grown to realize that being "talented" is not necessarily all it takes to be successful, especially as a diagnostician. Having access to and knowledge of how the appropriate tools function is crucial to efficiency and accuracy. But the quest for knowledge is most times the hardest to trek.
The third piece of the puzzle
That third piece of the puzzle — accurate information — is what I find to be the most challenging component of diagnostics. We can purchase the appropriate tooling, we can master that tool in its entirety, we can even spend our free time practicing to understand how individual components and systems function. But if we don’t have the crucial information required to make a sound diagnostic decision, we will likely find ourselves up the creek and without a paddle. Guesswork will not cut it today!
There has been a standing debate, specifically between mobile diagnostic technicians and those bound within the walls of a brick-and-mortar facility. The age-old question remains — OE tooling or aftermarket tooling? My answer? It depends. Some situations simply require OE tooling. Whether it's called upon due to an aftermarket tool lacking the ability to communicate with certain nodes or the OE tool is the only one capable of some post-software flash routines, it’s something we will all have to face from time to time.
With the implementation of the Massachusetts Right To Repair Act (R2R), aftermarket tool manufactures are gaining more and more access to the precious information we desire in the aftermarket automotive service and repair side of the industry. With the advancement in technology comes state-of-the-art systems like Advanced Driver Assist Systems (ADAS). As you are all probably aware, the cooperation of many different components across a medley of systems communicating on multiple bussed networks makes up ADAS technology.
The original R2R mandated manufacturers give access to the aftermarket for information necessary to accurately diagnose and repair systems pertaining to emissions only. With technology like ADAS, that simply won’t be enough. In time I believe you will see more and more information be made available to the aftermarket.
Diagnostics and enhanced data
The information available from the vehicle can be obtained in different ways. There are multiple access points for data and these are determined by how the data link connector (DLC) is configured. The DLC construction is standardized or mandated to be configured a certain way, according to OBDII rules. This standard is known as SAE J1962. Certain terminals are reserved for certain communication protocols. Other terminals are set aside for the manufacturers' discrepancy. Here, I’ve marked just a handful of the terminals that are designated (Figure 1). Each communication protocol is a language in itself. The language is determined by characteristics like the following:
- Number of wires comprising the network (single-wire, twisted-pair)
- What the terminating resistance of the network is
- The speed at which the network communicates data (bits per second)
- The voltage levels in which communication takes place
- Amplitude of the resting (or recessive) network voltage and also during communication (or dominant).
The above is to just name a few.
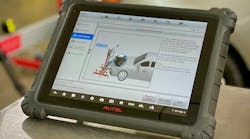
The OE tooling is designed to establish communication with every node on the subject vehicle’s communication busses. The aftermarket tooling likely will not be built with the ability to access all of the data from all of the nodes on all of the networks. True, all scan tools have their strengths (with certain makes/models) as well as their weaknesses (Figure 2). The reason being is quite simple. The cost to create a scan tool that could communicate with all nodes on all networks for every vehicle would be astronomical! I don’t think the return on investment (for the tool manufacturers or the technicians) could ever be realized!
Another point I'd like to stress is that manufacturers (with the enhanced data) are not required to exhibit any specific data or in a particular manner. They do so to assist technicians in addressing the vehicle. The tool and associated data weren't designed with you or me in mind. It was simply designed to provide a means for diagnosis to the factory-trained technician at the dealership, addressing the vehicle while it is under warranty. Very similar to how the factory troubleshooting flow charts are written, they exist to provide a solution most of the time to the average factory-trained technician with the least cost to the manufacturer.
We must understand the concept of substitute values. Let me explain by way of example. Picture a vehicle that utilizes multiple inputs providing data regarding temperature. Existing on many vehicles are not only one but two different engine coolant temperature sensors (ECT1/ECT2), a transmission fluid temperature sensor (TFT), and an intake air temperature sensor (IAT). Let's now assume that three of the four inputs report similar data. However, the fourth one has a circuit issue and causes the voltage reported to the ECU to be out of range, resulting in a related circuit-high DTC.
If one were to reference the live enhanced data parameter identifier (PID), you may see that although the circuit is open, the PID still reflects a similar temperature reading as the other three temperature inputs. This could certainly steer us wrong in many situations. I’m confident at some point in time we have all come to realize this. Think of that time where you saw a PID value that just didn’t make sense. True, a default value that doesn't change at all sticks out like a sore thumb, but one that reflects logical (but false) data can steer you wrong quickly.
The generic side of scan tool data
Along with the boundaries set forth by R2R is the governing body of the Society of Automotive Engineers (SAE). They are responsible for setting the standards all automotive manufacturers must abide by. Not only must the automotive manufacturers engineer the powertrain and emission systems information accordingly, but the automotive tool manufacturers must also provide certain information on display (regardless of the vehicle make/model) if the vehicle is certified with an OBDII designation. This mandate is known as SAE J1979 (emissions-related OBD).
When we are talking about drivability what we need can not only be found on the enhanced side but must be available on the generic side of the scan tool data. Plain and simple, certain rules have come to be regarding how PIDs must be displayed on the scan tool. There are many benefits to choosing to view generic data over enhanced data. Because these rules exist, I know I can count on and rely on the data to exhibit in a certain fashion. For example, there are no substitute values (like discussed above). Manufacturers must display the data as-is, without substitution. However, what is most important for me is the apples-to-apples comparison of how PIDs are defined.
For another example, I'd like to reference data PIDs reflecting wide-band air/fuel ratio sensors. How these sensors’ data is reflected on the scan tool enhanced data list varies greatly from automotive manufacturer to manufacturer. Some choose to display the data on a voltage scale where others use amperage (or sensor current). Of the manufactures that choose to use the voltage scale, some will reflect “stoichiometry” at 3.3 volts (like Toyota) where Subaru will display 1.52 volts under the same conditions. Unless you are at the dealership level or specialize in a certain make (seeing the same vehicles/issues daily), it is just too much effort and there is too much brainpower dedicated to familiarizing yourself with what "normal" looks like for every manufacturer.
Apples to apples
The beauty and simplicity behind the mandated and standardized OBDII scan data PIDs is that it creates a platform for becoming familiar with what applies to the majority. Rather than learning and becoming familiar with how each manufacturer displays each PID, you can focus on the PIDs (how they are displayed) that are common to most makes/models. Of course, I have an example. We will use the same air/fuel ratio example from above:
Rather than focusing on the A/F data we typically see on the enhanced side of the scan tool (the data that is different under similar operating conditions, between manufacturers), we instead can focus on the ones that reflect the same between manufacturers. A PID that comes to mind is “LAMBDA.” LAMBDA is derived via a math equation, dividing the stoichiometric air/ fuel ratio into the actual measured air/fuel ratio (Figure 3). This yields us a value that is recognizable, regardless of the vehicle we are addressing.
Why is LAMBDA so valuable? For one, there are many different fuels out there (diesel, gasoline, ethanol, methanol, liquid propane, and compressed natural gas). Stoichiometry (or the ideal air/fuel mixture) for pure gasoline is 14.7:1. Gasoline is seldom pure but besides that stoichiometry is different depending on the fuel being used (Figure 4). An extremely rich mixture of 6.4:1 is needed to achieve the ideal air/fuel ratio utilizing methanol. However, if that much fuel was delivered using gasoline, the spark plugs would be fouled almost instantly, and the engine wouldn’t even run!
So, rather than attempting to familiarize oneself with all that data or the associated variations in displayed A/F sensor values, LAMBDA will normalize it for us, in that apples-to-apples comparison between manufacturer-supplied data. The perfect air/fuel ratio is one where all of the components of the fuel and oxygen are chemically converted during the combustion process. This is LAMBDA and is the same, no matter what fuel is being used!
Building that PID-O-Full data list
Above is just an example of the method to my madness. But, when it comes to building a PID list, I’m frequently asked “What PIDs do I need to see?” Again, my answer: It depends. You'll likely take notice of the common theme among many of the articles I’ve submitted to print. When it comes to diagnostics, I need the data to tell a story. This story should reflect:
- Engine operating conditions
- Key inputs that reflect how the engine is breathing, how the engine is being fueled, and the load placed upon the engine.
- The feedback system PIDs reflecting how hard the PCM is working to keep the engine running properly (fuel trim/heated exhaust gas sensor data)
It all boils down to inputs vs outputs. Computers are not smart devices. They are simply swift when it comes to number crunching. As the inputs come in, the PCM considers them (processing) and decides on what the output should be. The output, for instance, might be fuel injector pulse width. If anything went wrong with the processing (false input, faulty logic) the wrong injector pulse width will be commanded, leading to either over-fueled or under-fueled cylinders. It’s then the job of the feedback system to recognize this deficiency. The reporting heated exhaust gas sensors will allow the PCM to fine-tune the commanded injector pulse width and will do so until the response from the feedback system is satisfactory.
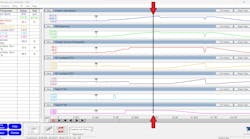
I desire to see these initial PIDs that tell that entire story above (Figure 5). These include the following:
- RPM
- Relative throttle position
- MAF or MAP/BARO sensor signals (infers breathability)
- Calculated load and/or absolute load
- Heated exhaust gas sensor signals
- Fuel trim/loop status
As of 2008, OBDII rules mandated all generic PCM data is found on CAN-c (Found on DLC terminals #6 and #14). The language of that protocol dictates that it must communicate data at a speed (or baud rate) or 500k-1M bits per second. With that being said, limiting a custom data list to 5-10 PIDs will allow the data refresh rate to update about 20 times per second! What I'm getting at is the speed of data transfer is no longer a hindrance (as it tended to be pre-2008) and is close enough to real time that it will serve us well, right from the driver’s seat. With a combination of the PIDs listed above and putting the engine through different operating conditions, one can get a preliminary evaluation of how the engine is breathing, how it's being fueled, and how hard the PCM may be working to ensure proper fuel delivery.
My intent was not to fix the car but to gather data and perform an analysis swiftly, with little energy invested and without disassembly. It’s these easy-to-perform evaluations that should drive your diagnostic approach. Use test results like this to determine your next move. All of these PIDs can be found in the generic data.
An exercise for the mind
For instance, if a vehicle was configured with a V6 engine and a twin-bank port-injected fuel system, and perhaps was under fueled due to a restriction in only one half of the fuel rail I would expect the PCM’s base fuel delivery command to be insufficient on that one bank. As a result, I would likely expect a drivability symptom of a loss in power output, misfires, and/or an increase in fuel trim on that one bank. The simple fact that the fault only occurs on one bank automatically eliminates any input for the base fuel injector pulse width equation (MAF, MAP, ECT, TPS, BARO). I would then focus my efforts on a fault for one bank only.
The fault would certainly worsen under certain conditions. By operating the vehicle under different load/rpm ranges one would notice a trend. With heavier loads, the fault would progress. This would be reflected as an increase in fuel trim the heavier the load becomes. This would indicate a lack of fuel delivery.
I would then reference not only the primary heated exhaust gas sensors but the secondary sensors as well. If both the sensors (for the suspect bank) showed a "lean condition" (abundance in oxygen) it would validate that the sensors are reporting the same lean condition. The fact that both the sensors tell the same story would make them unlikely to be faulted inputs. However, if the suspect bank’s heated exhaust gas sensors told conflicting stories, I would suspect those inputs to be the cause of the fuel delivery miscalculation (Figure 6).
You see, it’s all in getting familiar with the data. We need the data to tell a story. This will allow you to effectively focus your attention on other inputs/data that will bring you closer to a diagnosis. Some issues will take longer to solve than others, but the key to success is being efficient as well as accurate. Focus your energy on mastering tools/techniques as well as data analysis that will serve you well on most vehicles.
Next time you’re faced with a drivability symptom try gathering data with your generic OBDII data list. You’ll be surprised how quickly you become familiar with the PIDs and which ones you need to view to tell the story.