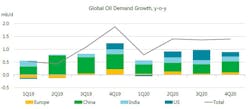
According to the latest oil market report from the International Energy Agency, global oil demand in the third quarter of 2019 increased by 1.1 million b/d year-on-year (y-o-y), the fastest pace in a year and more than double the 435,000 b/d seen in the second quarter of 2019. China’s demand increased by 640,000 b/d y-o-y in the third quarter, the biggest contributor to global growth.
IEA expects global oil demand to further accelerate to 1.9 million b/d, supported by a comparison with a weak 2018 fourth quarter demand, lower y-o-y prices and robust US petrochemical demand.
For the whole year 2019 and 2020, IEA’s global demand growth forecasts are unchanged, at 1 million b/d and 1.2 million b/d, respectively.
IEA has incorporated the October release of the International Monetary Fund (IMF) World Economic Outlook into its projections. For 2019, IMF world GDP growth was revised slightly down to 3% and 2020 growth was revised down to 3.4%, reflecting a general weakening in economic activity.
“However, the health of the global economy remains uncertain in spite of recent positive news about the US-China trade dispute. This year, we are seeing a big difference in demand growth in the two biggest oil markets. In the US, there has been almost no growth in the first three quarters of 2019, while China has grown by 600,000 b/d on average. Moving into 2020, US growth is expected to pick up to 190,000 b/d while China slows to 375,000 b/d,” IEA said.
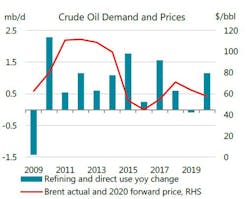
Meantime, slower refining activity in the first three quarters of 2019, combined with lower rates of direct crude use, resulted in total demand for crude oil declining by 300,000 b/d y-o-y. Even with IEA’s 660,000 b/d forecast for refining runs increase in 2019 fourth quarter, crude demand for 2019 as whole is set to contract for the first time since 2009, albeit by only 90,000 b/d.
Demand by regions
OECD demand contracted for the fourth straight quarter in 2019 third quarter by 40,000 b/d y-o-y, to reach 48.2 million b/d. The rate of decline eased vs. earlier in the year, due to a strong seasonal pickup in transport fuel deliveries (jet fuel, diesel and gasoline). By contrast, demand for petrochemical feedstocks naphtha and LPG/ethane fell by 90,000 b/d and 40,000 b/d y-o-y respectively, as slower economic growth and weaker petrochemical margins limited production. The largest declines were seen in Japan, the Netherlands, Norway, the UK and Turkey, whereas demand rose in Germany and France.
US oil deliveries showed robust growth of 215,000 b/d in September and preliminary data point to a rise of 275,000 b/d in October, driven by gasoline and jet fuel. IEA expects a strong recovery in ethane demand following a drop of 115,000 b/d m-o-m in August with the commissioning and ramp up of several ethane crackers before the end of the year. However, despite strong deliveries in recent months, estimated US oil demand growth of 50,000 b/d in 2019 would be the smallest annual increase since 2012 and well down from the 550,000 b/d seen in 2018.
Non-OECD oil demand growth is estimated at 1.1 million b/d y-o-y in 2019 third quarter and is expected to accelerate to 1.2 million b/d in 2019 fourth quarter.
Chinese growth has remained very strong, at around 640,000 b/d in 2019 third quarter. Chinese apparent oil demand, based on refinery runs and net imports of products, reached a record high above 14 million b/d in September. China’s oil demand growth averaged 580,000 b/d y-o-y in the first nine month of 2019, a faster pace of growth than the 490,000 b/d recorded in 2018. For the year of 2019, China’s oil demand is expected to reach a new record high of 13.6 million b/d, up 580,000 b/d on 2018.
Chinese economic indicators were mixed in October, as the official manufacturing PMI (more oriented toward large state-owned companies) remained below 50, pointing to a contraction in industrial activity for the sixth consecutive month, while the Caixin/Markit PMI (which covers small and medium sized companies) ended up stronger than expected at 51.7. Chinese car sales fell for the 16th consecutive month in October, down 4% y-o-y, reportedly suffering from early implementation of new vehicles emission standards.
Indian oil demand remained stagnant y-o-y in September. Gasoil/diesel consumption dropped by 50,000 b/d y-o-y and naphtha demand by 85,000 b/d. LPG and gasoline demand contributed to support growth, however.
Supply
Saudi Arabia’s rapid recovery from attacks on its energy sector drove global oil supply up 1.5 million b/d m-o-m in October. The Kingdom alone contributed 1.4 million b/d to the rise. There were also substantial increases from Norway, Canada and US.
However, at 101 million b/d, world oil production was down 1.2 million b/d y-o-y. Driven by US, non-OPEC supply was up 1.3 million b/d on a year ago, while OPEC was down 2.5 million b/d due to OPEC+ supply cuts as well as losses in Iran and Venezuela due mostly to sanctions.
Ahead of the 5-6 December meetings of the OPEC+ countries, the group’s output remains below its target. The compliance rate delivered by the 24 producers was 111% in October, but production was at its highest since February when Saudi Arabia last pumped more than 10 million b/d of crude. Total OPEC crude output rose 1.06 million b/d to 29.91 million b/d.
“The OPEC+ countries face a major challenge in 2020 as demand for their crude is expected to fall sharply,” IEA said. According to IEA’s current outlook, during the first half of 2020, the call on OPEC crude falls to 28.2 million b/d versus 30.2 million b/d in 2019 fourth quarter.
Surging non-OPEC supply explains this drop, with growth of 2.3 million b/d next year versus 1.8 million b/d in 2019. While the pace of US expansion slows, significant contributions are expected from Brazil, Norway and newcomer Guyana.
Financial analysis of OPEC+ deal
“Three years into supply cuts, those taking part are still earning more than they were before the initial deal was agreed in 2016 fourth quarter when OPEC was producing at its highest ever,” IEA said.
“On average this year, OPEC has earned $1.9 billion a day, up $350 million per day (mln/d) on the last three months of 2016 while producing nearly 3 million b/d less. So far this year, Saudi Arabia is earning $630 mln/d, up $125 mln/d on the 2016 fourth quarter. It is bearing the burden of the OPEC+ supply cuts, with output down around 740,000 b/d versus the fourth quarter of 2016. Russia has seen its revenue increase by $170 mln/d to $670 mln/d, as its output is only 75,000 b/d lower than in 2016 fourth quarter. The only OPEC producers not making more money are Venezuela and Iran, where output has plunged.”
Stocks
After increasing for five consecutive months, OECD commercial stocks drew 38.9 million bbl in September to 2,944 million bbl. They were 21.5 million bbl above the 5-year average and covered 60.7 days of forward demand, one day below the average.
Preliminary data for October showed total stocks falling in US and Europe, while inventories gained in Japan. Floating storage of crude oil fell 6 million bbl in October to 64.1 million bbl. The number of Iranian VLCCs used for storage increased by 1 to 27.


